


Our knowledge of the significance of the right heart has considerably improved in the past few decades as new imaging techniques have enabled more detailed study of the right heart anatomy, physiology and pathophysiology. Many studies have emphasized the role of right heart structure and function as an important predictor in the case of heart failure, pulmonary hypertension (PH), and congenital heart disease.1,2 Right-sided heart dysfunction occurs in several conditions, such as right ventricular MI, left-sided heart failure, congenital heart disease, PH, chronic lung disease, sleep-related breathing disorders, acute pulmonary embolism, and pulmonary/tricuspid valve disease. The main function of the right ventricle (RV) is to ensure adequate pulmonary perfusion pressure in different circulatory and loading situations, and to preserve a low systemic venous pressure. The interaction between preload, contractility, afterload, ventricular interdependence and heart rhythm determines the regular RV function. Echocardiography is a non-invasive diagnostic tool that can be used to assess the function of the right heart. The measurements to be performed and reported should involve qualitative and quantitative parameters of the right heart (Table 1). This review describes the most commonly used echocardiography methods and measurements for the analysis of right heart anatomy, function and hemodynamics.
Right Ventricular Anatomy, Location and Physiology
The RV is located immediately behind the sternum and anterior to the left ventricle (LV). It extends from the right atrium (RA) to the apex of the heart, forming the majority of the anterior surface of the heart, and marks the inferior border of the cardiac silhouette. While the LV has a conical shape, the RV is shaped like a pyramid and appears as an additional slice of tissue wrapped around the circular LV, particularly when viewed in a section across the short axis. The RV contains inflow and outflow compartments and is made up of the free anterior wall, posterior wall and interventricular septum.3 The complicated geometric form of the ellipsoidal shell model that covers the conical shape of the LV and the trabeculated myocardium at the apex prevents simple evaluation of RV size and function by transthoracic echocardiogram. The RV has the same stroke volume as the LV, but needs only 25% of the stroke because pulmonary resistance is low. The muscle fibers of the RV have a longitudinal orientation from the valve annulus to the apex, and in this way obtain longitudinal contraction.4 The RV wall is thin (3–5 mm, excluding trabeculations) compared with the LV myocardium and in the case of increased pulmonary pressures or volume overload, it can respond with hypertrophy, dilatation and increased contractility.5 The tricuspid valve has a crucial role in the normal function of the RV. Evaluation of the morphological features of the RV requires the following projections:3
- Parasternal long axis plane (to demonstrate the RV outflow tract and the moderator band that connects the ventricular septum to the parietal wall, and to exclude it when evaluating the diameter of the ventricular septum).
- RV inflow tract views (to display the Eustachian valve behind the mural leaflet, and evaluate the anterior and inferior RV wall).
- RV outflow tract views (to display the RV outflow curving over the LV, the pulmonary valve, and the bifurcation of the pulmonary trunk in the left and right arteries).
- Short axis planes (to display the crescentic shape of the RV).
- Apical four-chamber plane (this is optimal for morphological assessment, measurement of the tricuspid valve, RV dimension, display of the septomarginal trabeculation, the moderator band and the pulmonary veins at the back of the left atrium).
- Apical long and three-chamber view (to display the RV outflow in a similar way to the parasternal long axis view).
- Subcostal projection (to display the diaphragmatic wall of the RV).
Many studies have been performed to identify and establish the normal reference ranges for the echocardiographic measurements of the right heart.6–8 The measurement of the following dimensions is recommended for right heart assessment:
- RV basal–apical: transverse measurements of the RV in four-chamber imaging vary significantly because the normal RV has a complex geometric triangular form. In the four-chamber view, the RV is measured at the base with an upper reference limit of 41 mm, at mid-diameter at the level of the papillary muscles with an upper reference limit of 35 mm, and in the longitudinal dimension with an upper reference limit of 86 mm.
- RV wall thickness (subcostal long axis view at end-diastole, it is important to exclude trabeculations and papillary muscle, with measurements >5 mm considered abnormal).
- RV outflow tract (RVOT): the anatomy of the RVOT is important and it is located between the supraventricular crest and pulmonary valve; it consists of the conus arteriosus (infundibulum), ventricular septum and RV free wall. Measurement is done of the proximal diameter of the RVOT or the subvalvular level (parasternal long axis, upper reference limit 33 mm), and the distal diameter of the RVOT or pulmonary valve level (parasternal short axis, upper reference limit 27 mm).
- RV area (four-chamber view at end-diastole by planimetry of the RV cavity, excluding trabeculations and excluding the moderator band, with an upper reference limit at end-diastole of 24 cm2 in men and 20 cm2 in women).
- Inferior vena cava (IVC) dimension: the dilatation of the IVC with diameter >21 mm in the case of chronic heart failure suggests hemodynamic congestion. The RA pressure algorithm is used to evaluate the diameter of the IVC and also the degree of inspiratory collapse of the IVC (IVC diameter ≤2.1 cm collapse with sniff >50% indicates normal RA pressure; IVC diameter ≥2.1 cm collapse with sniff <50% indicates high RA pressure). When the parameters of IVC diameter and collapse do not fall within these limits, an intermediate value of RA pressure may be used, or other secondary markers of elevated RA pressure could be involved.5–8
Assessment of Right Ventricular Function
The function and consistency of the RV is a strong predictor of many cardiovascular diseases. The assessment of RV function by transthoracic echocardiogram is limited due to the complex anatomy and particular shape of the RV. The biggest contraction of the RV takes place longitudinally from base to apex, providing most of the stroke volume. A significant number of echocardiographic parameters have been accepted and validated and each of them has its drawbacks and limitations. Integrating and combining these parameters may more reliably determine normal or abnormal RV function. Among them are the following parameters: visual examination; RV index of myocardial performance (RIMP); tricuspid annular plane systolic excursion (TAPSE); 2D RV fractional area change (FAC); 2D RV ejection fraction (RVEF); 3D RVEF; tissue Doppler-derived tricuspid lateral annular systolic velocity (S΄); and longitudinal strain and strain rate.7,8
Visual Examination
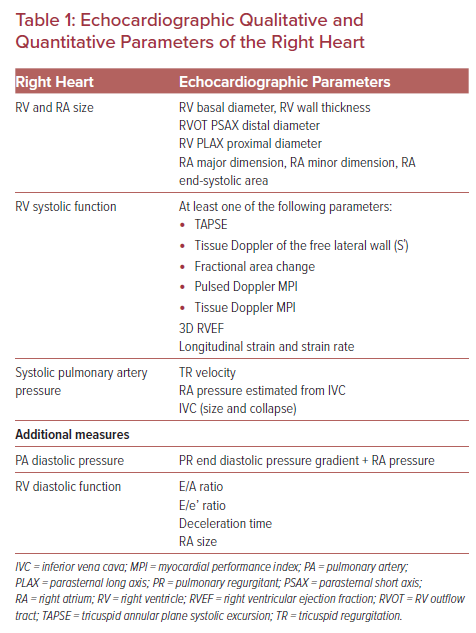
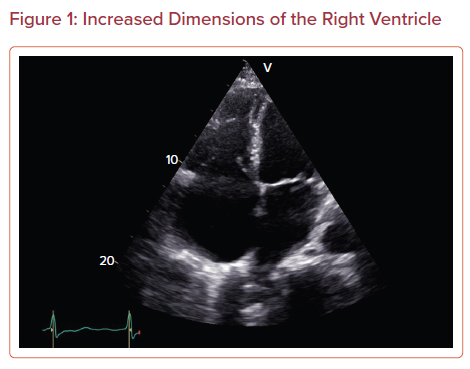
The dimension of the RV should be compared with the size of the LV. The normal size of the RV is approximately two-thirds the size of the LV apical four-chamber and parasternal long axis views. RV size can be evaluated by tracing the endocardial border or measuring the dimensions. If the RV has a larger length or diameter, it is probably due to the dilatation of the RV (Figure 1). Endocardial tracing of the area of the RV has a higher correlation with echocardiographic estimations of RV size and function than with MRI estimations.9 Abnormal septal motion with septal flattening and an abnormal LV D-shape on short axis view may indicate RV volume or pressure overload (Figure 2). However, visual examination is often dependent on the observer and their experience.
Tricuspid Annular Plane Systolic Excursion
TAPSE is the most commonly used and simple method for the evaluation of RV function. This parameter, derived from apical four-chamber view with M-mode, measures the distance of systolic excursion of the RV segment (lateral tricuspid valve annulus) along the longitudinal plane. The disadvantage of TAPSE is that it evaluates a single segment that only partially characterizes the function of the entire RV. TAPSE is easily measured, and values lower than 16 mm indicate RV dysfunction. The width of excursion correlates with RVEF (5 mm = 20% RVEF, 10 mm = 30% RVEF, 15 mm = 40% RVEF, 20 mm = 50% RVEF).
RV systolic function as evaluated with TAPSE can be used to assess the risk of cardiovascular death in many cardiovascular diseases.7,9–11 The ratio of TAPSE to systolic pulmonary artery pressure (i.e. TAPSE/SPAP) enhances the prognostic risk stratification in patients with heart failure and a ratio <0.36 mm/mmHg indicates a higher probability of mortality in patients with heart failure.12
Tissue Doppler of the Free Lateral Wall
This parameter of apical four-chamber tissue Doppler evaluates the longitudinal velocity of excursion of the basal free wall segment and tricuspid annulus to assess basal RV free wall function. The disadvantage of this technique is that the evaluation of the function of a single segment is used to characterize the function of the global ventricle. It is easily measured and reproducible, and values of <10 cm/s indicate RV dysfunction.
Right Ventricular Index of Myocardial Performance
This parameter is a global estimate of both systolic and diastolic function of the RV and is not dependent on ventricle geometry. It is defined as the ratio of the isovolumetric time interval to the ventricular ejection time and it is obtained using the pulsed Doppler method and the tissue Doppler method, with the following formula: RIMP = (tricuspid valve closure time − ejection time)/ejection time. This formula can also be given as RIMP = (TCO − ET)/ET or IVRT + IVCT/ET, where TCO is the tricuspid valve closure–opening time, IVCT is the isovolumetric contraction time, IVRT is the isovolumetric relaxation time, and ET is the ejection time. The disadvantage is that the method is not valid with the irregular rates that are found with AF and elevated RA pressure. Values of RIMP >0.4 using pulsed Doppler and >0.55 using tissue Doppler indicate RV dysfunction and lower values indicate normal function of the RV, given that less time is taken in the isovolumetric state and more time is taken in ejecting blood.6
Fractional Area Change
RV FAC is given by the following equation: 100 × [(end-diastolic area − end-systolic area)/end-diastolic area]. This method from four-chamber view involves tracing the endocardial borders of RV during systole and diastole, including trabeculations and tricuspid valve leaflets. The parameter has prognostic value and is an independent predictor of mortality in cases of acute MI, heart failure, pulmonary embolism and PH. Values <35% indicate RV dysfunction.8
3D Volume Estimation
This technique evaluates RV volume without relying on the geometric particularities of the complex shape of the ventricle.11 This method is more complex and is dependent on image quality, and it tends to underestimate the RV volumes measured by MRI. The lower reference limit of 3D RVEF is 45%.
Strain Imaging: Regional RV Strain and Strain Rate
This method uses dimensionless parameters tο measure myocardial deformation, and represents regional and global myocardial systolic function. Strain is determined as the percentage change in the length of the myocardial segment, and strain rate represents the rate of deformation of the myocardium over time.7,8,13 One-dimensional strain evaluated on Doppler tissue imaging is angle dependent while 2D speckle-tracking echocardiography is an angle-independent measurement. The 2D strain is a precise method to assess RV global and regional function. Global strain of the free lateral wall of the RV is measured by the average peak systolic strain of the three segments of the free lateral wall in four-chamber view. High negative strain values indicate better systolic function and values less than −20% indicate reduced RV function. The mean RV strain in normal conditions is −29 ± 4.5%.5,8,14 The technique is not recommended for routine clinical evaluation and is best reserved for specific clinical conditions.
Right Atrium Volume
Increased RA dimensions can be an indication of volume and pressure overload, and increased RA pressure is an indication of RV dysfunction. This method involves the measurement of RA volume from the four-chamber view. Normal values are 21 ± 6 ml/m2 for men and 25 ± 7 ml/m2 for women.9,15
Right Ventricular Diastolic Function
RV diastolic dysfunction increases atrial pressures and decreases collapsibility of the IVC. Pressure and volume overload mechanisms, such as lung disease, cardiomyopathies, ischemic heart disease and LV dysfunction, mediate ventricular interdependence and can lead to RV diastolic dysfunction. The evaluation of the following parameters are recommended for the assessment of RV diastolic function:
- 2D morphological assessment of the RV, size of the IVC, inspiratory collapse.
- Doppler velocities of the trans-tricuspid flow (E, A, E/A). Trans-tricuspid flow is susceptible to preload and afterload.
- Tissue Doppler velocities of the tricuspid annulus (E΄, Α΄, Ε/Α΄), deceleration time, isovolumetric relaxation time.7,16
- Pulsed-wave Doppler for hepatic vein flow assessment. The main components of hepatic vein flow are the systolic wave (S), systolic reversal wave (SR), diastolic wave (D), and the atrial reversal wave (AR). S/D < 1 indicates increased RA pressure. Hepatic vein systolic filling fraction <55% denotes increased RA pressure. Prominent systolic and atrial reversal waves may also indicate raised RA pressure.
Various studies demonstrate the use of RV diastolic function assessment in the diagnostic and therapeutic management of patients.17 Fenster et al. evaluated the extent to which RV diastolic function is associated with exercise capacity in chronic obstructive pulmonary disease. RV diastolic function was assessed using the ratio of early to late tricuspid valve velocities, and an increased tricuspid valve E/A ratio was associated with an increased 6-minute walk test distance.18 Kosmala et al. assessed RV systolic and diastolic function in people with diabetes. In patients with diabetes without clinically evident heart disease, the RV function is impaired, and is indicative of diastolic abnormalities such as increased IVRT and decreased RV E’/Α’.19 Various echocardiographic markers are used in the evaluation of patients with hypertrophic cardiomyopathy (HCM). Pagourelias et al. evaluated the significance of transthoracic indices of RV diastolic function in HCM patients. RV E/E’ >6.9 was an independent predictor of heart failure mortality and of a 1.6-fold increased risk of death from heart failure.20
Tricuspid Valve
The free margins of the tricuspid valve are linked to the ventricular wall by tendinous cords attached to papillary muscles that are contiguous with the subjacent ventricular walls. The structure of the tricuspid valve consists of the annulus, three leaflets (anterior, posterior, septal), the chordae tendineae and the papillary muscles (usually three papillary muscles). The tricuspid valve is located apical-most and the occupied annulus area is 8–12 cm2. The most frequent condition of the tricuspid valve is regurgitation, which is differentiated into primary valve lesion and functional regurgitation. Functional regurgitation will usually lead to annular dilatation and increased tricuspid leaflet tethering due to pressure and volume overload of the RV. These conditions include PH, left heart disease and situations resulting in dilatation of the RV (RV infarction and pulmonary embolism). The echocardiographic approach for the evaluation of tricuspid regurgitation (TR) involves the following parameters.
Qualitative Methods
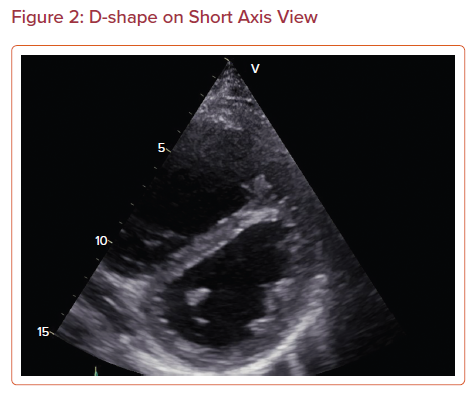
- Morphology of the tricuspid valve: flail valve and a large coaptation defect indicate severe TR (Figure 3).
- Annular diameter: annular dilatation indicates severe TR.
- Color-flow TR jet: a very large central jet indicates severe TR, while an eccentric jet that hugs the RA wall will underestimate TR severity.
- Continuous wave TR jet: velocity and shape are indicative of TR severity; a dense envelope indicates severe TR, while poor alignment with an eccentric jet will lead to underestimation of severity.21–23
Semi-quantitative Methods
- Vena contracta width: this is optimal for distinguishing mild from severe TR; it can be used for eccentric jets, but not for multiple jets; a width >7 mm indicates TR.
- Hepatic vein flow: systolic flow reversal indicates severe TR.
- Peak E velocity: this is increased in severe TR (E-wave dominant ≥1 m/s).
- Proximal isovolumetric surface area, proximal isovelocity surface area (PISA) (radius >9 mm indicates severe TR).21–23
Quantitative Methods
- PISA can also be used to measure the effective regurgitant orifice area (EROA) and regurgitant volume; EROA >40 mm2 and regurgitant volume >45 ml indicate severe TR. Although it can be used in eccentric jets, the method has numerous limitations such as that the regurgitant orifice is rarely round and the movement of the annulus during systole influences the measurement.
- RA and RV size: enlargement of the RA and RV indicates severe chronic TR.21–23
Clinical Implications
Echocardiography is a non-invasive diagnostic procedure most commonly used in the evaluation of patients with PH and pulmonary embolism. It is an important imaging procedure for determining structural and functional cardiac status and has prognostic and research value. Dysfunction of the LV secondary to MI and heart failure can influence the function of the RV. Echocardiographic assessment of the RV is useful for the evaluation of patients with left-sided heart disease. Diseases involving the tricuspid valve, such as carcinoid disease, rheumatic tricuspid disease, and myxomatous degeneration of the tricuspid valve, can also affect the function of the RV. Common congenital deformities include atrial septal defect, and patients with postoperative tetralogy of Fallot and Ebstein disorder can end up with RV dysfunction. Many studies have described the role of right heart structure and function as important predictors in patients with chronic lung disease and sleep-related breathing disorders.24–30 Echocardiography plays an important role in the detection of RV dysfunction in various clinical scenarios, and a crucial role in patient follow-up.
Pulmonary Hypertension
PH includes various clinical conditions and can complicate many cardiovascular and respiratory diseases. PH is defined as an increase in mean pulmonary artery pressure ≥25 mmHg at rest as confirmed on right heart catheterization. The classification of PH is based on the five groups of clinical conditions that cause it:
- Pre-capillary PH with normal pulmonary artery wedge pressure (PAWP) ≤15 mmHg.
- Post-capillary PH due to left heart disease with increased PAWP >15 mmHg.
- PH due to chronic lung disease and hypoxia.
- Chronic thromboembolic PH.
- PH due to unclear and various mechanisms.17,24
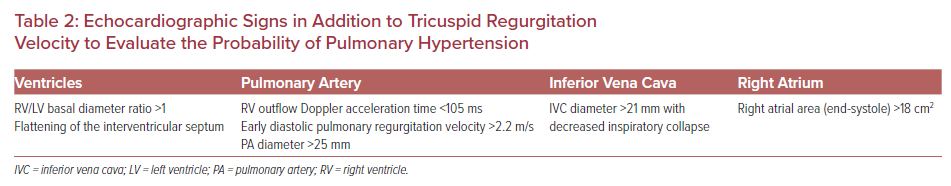
The following echocardiographic parameters are crucial for the assessment of patients with suspected PH: TR velocity (TRV), dilated RV, flattening of the interventricular septum, short pulmonary valve acceleration time, pulmonary artery diameter >25 mm, dilated RA, and decreased inspiratory collapse of the IVC. Echocardiographic signs in addition to TRV are used to evaluate the probability of PH (Table 2). The standard echocardiographic method uses the evaluation of RV pressure from the TRV and the qualitative assessment of RA pressure. Applying the simplified Bernoulli equation, p = 4(TRVmax)2, the peak TRV is squared and multiplied by 4.25 Even small errors in the absolute measurement of TRV can result in significant differences in the measurement of RV systolic pressure (RVSP). The evaluation of RVSP from TRV requires precise alignment with the TR jet, otherwise it may be under- or overestimated. This can be prevented by using agitated saline or contrast agents.26,27
Furthermore, to estimate SPAP, the RVSP is added to the RA pressure derived from the measurement of the IVC diameter after inspiration. In many cases, the diameter of the IVC cannot be measured or the concordance between the echocardiographic evaluation of RA pressure and the invasive method is as low as 34%.26
In the assessment of the probability of PH, the measurement of TRV should be used in coordination with other echocardiographic markers of PH. The guidelines for PH recommend examining an RA area >18 cm2 for echocardiographic signs of elevated RA pressure.27,28 In the case of TRV ≤2.8 m/s and without other echocardiographic signs of PH, the probability of PH is low. If TRV is ≤2.8 m/s but there are echocardiographic signs of PH, or TRV is 2.9–3.4 m/s and there are no echocardiographic signs of PH, then there is a medium probability of PH. In the case of TRV 2.9–3.4 m/s and the presence of other echocardiographic signs of PH or TRV ≥3.4 m/s without the presence of other echocardiographic signs, there is a high probability of PH.5,27,28
PH causes increased pulmonary vascular resistance and elevated pulmonary artery pressures resulting in maladaptive RV dilatation and, eventually, RV failure. Many studies have proposed the concept of RV–pulmonary artery coupling to define the cardiac function in PH and predict survival time.26–29 TAPSE is an afterload-dependent parameter and patients with a TAPSE/SPAP ratio <0.25 mm/mmHg have a worse prognosis.29
Pulmonary Embolism
The known echocardiographic signs associated with pulmonary embolism have been shown to have low specificity and sensitivity and to be present in only 20% of patients.30 These parameters include pulmonary ejection acceleration time <60 ms and peak systolic tricuspid pressure gradient <60 mmHg (the 60/60 sign), and depressed contractility of the RV free wall compared with the echocardiographic RV apex (McConnell’s sign). RV dilation occurs in up to 25% of patients with pulmonary embolism.8,30 The PEITHO trial used at least one of the echocardiographic markers for RV dysfunction to identify the group with an intermediate risk of pulmonary embolism: RV end-diastolic diameter >30 mm, RV/LV end-diastolic diameter ratio >0.9, RV free wall hypokinesis, or peak TRV >2.6 m/s.8,30
Conclusion
Routine clinical 2D echocardiography has largely been used to evaluate the structure and function of the RV. Current echocardiography techniques, including 3D and strain rate imaging, may be used to further contribute to diagnosis and facilitate the choice of treatment. Assessment of RV function and dimensions should be obtained using multiple parameters and performed using multiple acoustic windows according to the published limits in guidelines.